The spectacular rise and fall of folk data
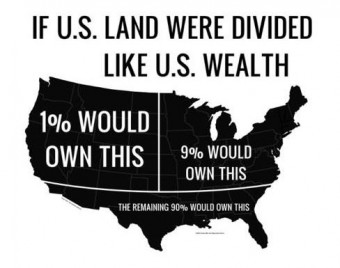
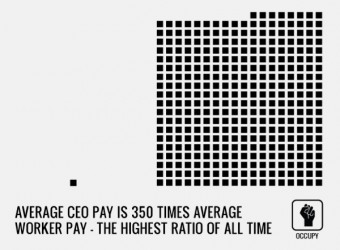
The Occupy Wall Street movement inspired thousands of charts, graphs, and statistical tables, efficiently rendering transparent what had remained opaque.
Dominic Pettman
March 9, 2012
Future digital archaeologists will notice something different about the virtual sedimentary deposits formed from global social networks in 2011.
Among the usual online artefacts that one might expect to find – puppies, cartoons, self-portraits, videos – something anomalous blipped onto the radar screen of popular consciousness for a few months before disappearing back into the swirling electronic soup of E-cards and YouTube links. These were viral images that would usually be quarantined in dry reports: politically charged graphs, charts, diagrams, or statistical tables that came to be known as “info.”
This material flew in the face of the truism that Internet memes need to be one of the four S’s: silly, sweet, scandalous, or salacious. So why would anyone click on a histogram instead of a photo of a baby sloth or an animated gif of a supermodel doing a face-plant on the Milan catwalk?
Many would credit a sudden rise in online political activism for what I would call “folk data.” The Occupy Wall Street (OWS) movement inspired thousands of jpegs of charts, graphs, and statistical tables, efficiently rendering transparent what had remained opaque: the egregious hyper-concentration of wealth into the pockets of the 1%. The headless and multi-tentacular nature of OWS stymied the mainstream media’s attempt to form a familiar narrative. Instead, today’s complex and apparently anonymous info-vectors raised consciousness, mobilizing people away from their computer screens and into the streets.
The spontaneous genius of the mathematical approach was two-fold: on one hand, it made the ideological mystification of high finance legible in byte-sized images that anyone could understand, providing maximum outrage with minimum semiotic energy. On the other hand, it was very difficult to argue against on the level of ideology, since these were usually well cited, referencing the objective report from which the data were taken. It appeared to strip away the politics, revealing the grim reality of the situation, snapshot by snapshot. What had previously been felt only in the bones of the economic casualties – the 99% – was now crystal clear, presented in a universal language. What Naomi Klein has called “the biggest heist in monetary history” was graspable by the eye in a few seconds, and thus by the mind.
The English word “propaganda” stems from “propagating” the political word of the 17 th century Vatican. It became a modern science under Goebbels, then diluted – but also refined – by Freud’s nephew, Edward Bernays, under the guise of “public relations.” In the age of Facebook, propaganda is in the hands of the people, both easier to make and to send around the world (but also harder to find under the a wide range avalanche of competing messages and information). In sum, propaganda has become a folk art, to the point where it has cross-pollinated with other memes. Given the cultural acceleration of the Internet, this itself has resulted in cute fluffy kittens, trapped in boxes, demanding not only a helping hand for roofing service but social and economic justice for all.
This is an electronic version of an article published in Reflex Magazine.


